Do your budgets for safety line up with the real risk your people face at work? Are your own workplace injury statistics 2026 projections based on data or on guesses? Many teams feel stuck between shrinking budgets, changing rules, and rising claim costs.
Workplace injury statistics 2026 simply extend patterns already clear in 2024 data. Nonfatal rates drift down a bit, but millions of cases and billions in costs remain. Using fresh numbers from the Bureau of Labor Statistics, AFL CIO, and National Safety Council, you can set sharper priorities, focus on the highest risk jobs, and stock the right first aid and trauma supplies.
In this article, you will see how current national trends point toward 2026, which injury types and industries drive most harm, how to plug those insights into your 2026–2027 safety plan, and how a focused first aid partner can help you act on the data. The goal is simple, turn statistics into fewer injuries and faster care on the floor.
How are workplace injury statistics trending going into 2026?

Workplace injury statistics 2026 are likely to show slightly lower rates, while total injuries and deaths stay very high. Current data shows a slow decline in rates, but millions of people still get hurt at work each year. For safety managers, that means you can claim some progress, yet you still need strong prevention and first aid capacity across your sites.
Recent numbers from the U.S. Bureau of Labor Statistics and AFL CIO give the clearest preview. Private industry employers reported about 2,488,400 nonfatal workplace injuries and illnesses in 2024, with an incidence rate of 2.3 cases per 100 full time workers. That is only a small drop from 2.4 the year before, so the actual pool of cases stays large even as the rate inches down.
On the fatal side, there were 5,070 job related deaths in 2024, with a rate of 3.3 deaths per 100,000 workers. AFL CIO also estimates roughly 135,000 deaths per year from occupational diseases like cancers and lung problems. When you add both figures, you get around 380 work related deaths every day, a level that will not vanish by 2026 without stronger action.
Key national numbers to watch
For 2026 planning, a short dashboard of headline figures keeps everyone aligned on the scale of risk. According to the latest BLS injury and illness data, private industry saw 2,488,400 nonfatal cases in 2024, with 888,100 that involved days away from work. The median time away was 8 days, which hits staffing and overtime budgets fast.
Fatal injuries totaled 5,070 in 2024, for a rate of 3.3 deaths per 100,000 workers across all sectors. AFL CIO estimates about 135,000 additional deaths per year from long term occupational diseases, which do not always show up in daily incident reports. When you plan for 2026, those disease numbers matter for long term health programs, not just short term incident response.
The National Safety Council estimates the total cost of workplace injuries and illnesses at about 181.4 billion dollars in 2024, a figure that sits against a broader backdrop of national health care spending that increased 7.2 percent to reach $5.3 trillion the same year. Its analysis of workers compensation data puts the average claim at roughly 47,316 dollars, with motor vehicle crashes, severe burns, falls, and amputations at the top of the cost range. The NSC work injury cost estimates are a useful reference when you need to show financial impact to senior leaders.
Why official numbers underestimate your real risk
Official statistics are only the visible part of your real injury risk. AFL CIO estimates that while employers reported about 3.1 million work related injuries and illnesses in 2024, the actual number in private industry may be between 5 and 7.5 million, a gap consistent with emergency department data on nonfatal work-related injuries tracked from 2012 to 2023. That gap comes from underreporting and from the way long term illnesses develop over time.
Workers may stay quiet because they fear retaliation, want to keep perfect attendance bonuses, or see injuries as part of the job. Supervisors may misclassify cases as non work related, or record only restricted work instead of days away. Heat related illnesses and long latency diseases from chemical exposure rarely get counted in day to day logs, yet they drive a large health burden and cost.
For workplace injury statistics 2026, that means your own records almost certainly miss part of the picture. When you size first aid stock, trauma kits, eyewash, and burn supplies, it makes sense to plan for higher real use than the OSHA log alone suggests. Combining national estimates, your claims data, and frontline feedback gives a more honest base for 2026–2027 budgets.
Which injury types and industries will drive your 2026 safety priorities?

Workplace injury statistics 2026 will still be shaped by a small group of causes and sectors that produce most serious harm. Transportation events, falls, contact with objects and equipment, violence, and harmful exposures dominate the fatal side. Soft tissue injuries, falls, and contact injuries dominate the nonfatal side. For safety managers, that pattern points straight to where you should focus your 2026 energy.
On the industry side, agriculture, mining, transportation, and construction keep some of the highest fatality rates in the country. Nursing and residential care, hospitals, veterinary services, and performing arts sit near the top for nonfatal injury rates. If your system includes these sectors, they deserve more prevention effort and more on site medical readiness.
Leading causes of serious and fatal workplace injuries
Cause of injury statistics help you pick the scenarios you must be ready to prevent and treat. BLS and National Safety Council data show that transportation incidents, falls, contact with objects and equipment, violence, exposure to harmful substances, and fires or explosions account for almost all fatal events, a pattern echoed in a secondary analysis of trends in occupational injuries drawn from the National Trauma Data Bank between 2017 and 2023. The table below gives a quick view.
| Cause | Approximate share of deaths | Focus for 2026 safety work |
|---|---|---|
| Transportation incidents | 38 percent | Driver safety, fleet kits, roadside trauma |
| Falls, slips, trips | 17 percent | Fall protection and fracture care |
| Contact with objects/equipment | 15 percent | Machine guarding and crush injury care |
| Violence by persons | 15 percent | Violence prevention and bleeding control |
| Harmful substances exposure | 14 percent | Chemical controls and decontamination |
| Fires and explosions | 2 percent | Burn protection and burn treatment |
The same sources show which events cost the most when they do occur. Motor vehicle crashes average around 91,433 dollars per lost time claim. Burns average about 64,973 dollars, falls and slips about 54,499 dollars, and caught in machinery claims about 47,749 dollars. Amputations can reach average claim costs of 125,058 dollars, which makes guarding, lockout, and bleeding control supplies especially important.
High risk industries and worker groups
Industry statistics show where deaths and serious injuries cluster. Agriculture, forestry, fishing, and hunting sit near 20.9 deaths per 100,000 workers, consistent with OSHA recordable injury rate data broken out by industry sector. Mining and oil or gas extraction are near 13.8, transportation and warehousing about 12.2, construction about 9.2, and wholesale trade about 4.6. These sectors mix heavy equipment, outdoor work, and remote locations, so they need strong field first aid and clear links to nearby clinics and hospitals.
Nonfatal injury rates look different. Nursing and residential care facilities see about 9.7 injuries per 100 workers, hospitals about 7.4, while performing arts companies and spectator sports are both near 11.3. Veterinary services sit around 10.6, and ski facilities near 10.3, with many sprains, strains, falls, bites, and head injuries. If you buy for these settings, ergonomic aids, slip control, and trauma kits for extremity and head injuries matter just as much as classic industrial PPE.
Demographic patterns add another layer. Hispanic and Latino workers have a fatality rate around 4.3 deaths per 100,000 workers, about 30 percent higher than the national average. Workers aged 55 and older account for more than one third of all fatalities, while women face a higher share of workplace homicides, especially in health care and social services. Mapping these patterns against your own rosters and shifts helps you rank which locations, job classes, and crews should get priority funding in 2026.
How should 2026 workplace injury stats shape your 2026–2027 safety plan?
Workplace injury statistics 2026 should act as a planning tool, not just a report for the board. When you line up national patterns with your claims, OSHA logs, and near miss reports, three themes stand out. You can pick a short list of priority risks, tune your training and procedures to those risks, and match first aid and trauma supplies to the injuries you most often see.
That approach keeps you from spreading limited resources across every possible hazard and lets you stack your 2026 and 2027 budgets around the biggest loss drivers.
Setting data driven priorities for prevention and training
A simple framework keeps data from turning into a wall of numbers. Start by listing your top three causes of claims and days away from work during the past 2 or 3 years. Compare that list with national patterns for transportation, falls, contact injuries, violence, and harmful exposures. When your local top three match national hot spots, you know those are the right places to aim your effort.
To make this practical:
For fleets and field crews:
Pair driver training with stronger roadside trauma capacity.
Review routes, fatigue risks, and vehicle inspection habits.
For hospitals and care facilities:
Focus on safe patient handling and aggression response drills.
Improve incident reporting so soft tissue injuries are not hidden.
For plants and job sites:
Update machine guarding and refresh lockout or tagout skills.
Address slips, trips, and working at height with focused refreshers.
You can turn this into a short action list for 2026:
Pick three targeted refreshers that match your biggest losses, such as driver safety, fall protection, or patient handling.
Schedule at least one drill for each high risk event, for example a fall from height, a road crash, or a violent incident in a lobby or waiting area.
Review your policies after every real event and drill so written rules keep pace with what staff actually face.
Aligning medical supplies and first aid with injury patterns

Once you know which injuries drive your claims, you can match supplies to those patterns. BLS data shows sprains, strains, and tears at more than 568,000 cases with days away from work, falls and trips near 479,000, and back injuries around 248,000. Eye injuries, hand injuries, burns, and head trauma add a steady stream of urgent but often treatable cases if the right supplies are close by.
Consider a simple checklist:
For musculoskeletal injuries:
Supports and braces
Cold and hot packs
Basic mobility aids where appropriate
For falls, struck by events, and violence related trauma:
Bleeding control kits with tourniquets and pressure dressings
Splints for limb injuries
Quick access to automated external defibrillators (AEDs)
For chemical and thermal hazards:
Eyewash stations and eye pads
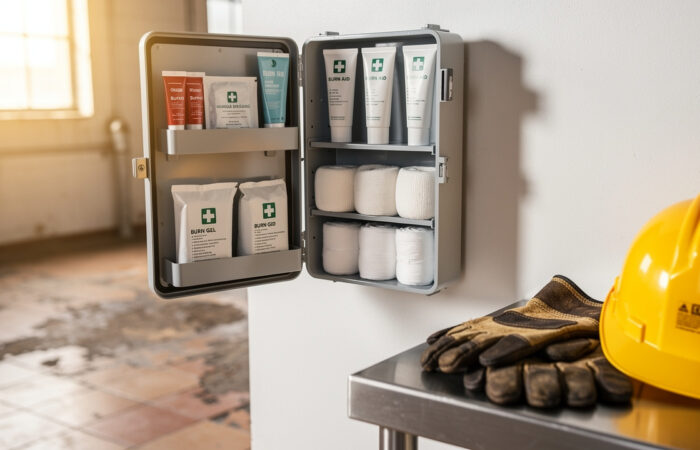
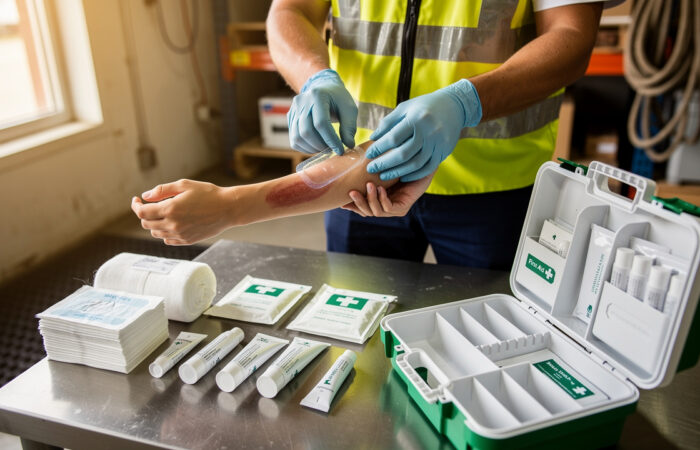
Burn gels and dressings
Gloves and masks matched to the chemicals on site
A focused wholesale partner can help you standardize contents so higher risk areas get larger trauma capability, while offices and low risk spaces keep simple, clean, clearly labeled kits that staff can use with confidence.
How to build a pathway from 2026 statistics to 2027 safety readiness
Workplace injury statistics 2026 also give you a rough timeline for change. Instead of one giant project, you can build a path from where you stand now to stronger safety performance by the end of 2027. The idea is to fix obvious gaps first, then deepen controls and stock levels as new data and policy signals arrive.
The BLS plans to release full 2025 nonfatal data in November 2026 and fatality data in December 2026. Those releases create natural checkpoints where you can test your plan, see if patterns are shifting, and reset your 2027 targets.
Phase by phase roadmap to 2027

You can sketch a clear three phase roadmap.
Phase 1: Now through early 2026
Compare your last few years of injury and claim trends with national statistics.
Fix obvious problems such as:
Empty or expired first aid kits
Missing eyewash in chemical areas
Fall protection that does not meet OSHA guidance from OSHA medical and first aid rules
Refresh core training where you see recent events, especially for drivers, supervisors, and new hires.
Phase 2: Mid 2026 to early 2027
As the 2025 BLS data comes out, check whether transportation, falls, violence, chemical exposure, and musculoskeletal disorders are rising or falling in your main industries.
Deepen prevention controls:
Better guarding and lockout or tagout discipline
Safer work schedules in extreme heat
Stronger violence response plans and building access control
Standardize kit contents across sites by risk level so a fall kit or burn kit looks the same in every plant and clinic.
Phase 3: Remainder of 2027
Track how incident rates, workers compensation costs, and medical response times change as you upgrade controls and equipment.
Adjust supply levels for peak seasons or regional issues such as hurricanes, wildfire smoke, or extreme heat.
Share measured safety gains with insurers, regulators, and hiring teams so they see that investment in prevention and first aid is part of your long term plan, not a one year reaction.
Across all three phases, make time for simple walk throughs:
Walk at least one site per quarter and compare what you see with your injury records.
Ask supervisors where they run short on first aid items.
Check how quickly staff can find and open a kit during drills.
Why choose us as your first aid partner for 2026–2027?
When you line up workplace injury statistics 2026 with your own records, you quickly see where first aid and trauma capacity must grow. First Aid Longs is a wholesale manufacturer that focuses on workplace first aid kits, eyewash solutions, burn gels, and related medical supplies built for these exact needs. The company uses in house manufacturing and 100K Class Cleanroom facilities, which helps keep quality consistent while holding costs down.
Products are aligned with OSHA guidance in 29 CFR 1910.151 and ANSI or ISEA Z308.1 Class A and Class B kit standards. That alignment helps reduce the risk of citations for missing or poor quality first aid gear, while giving you a clear map for what each kit should contain. Flexible minimum order quantities and bulk options make it easier to support both a single surgery center and a large multi state network of warehouses or construction sites.
For multi site operations, scheduled replenishment and refill packs help keep hundreds of kits aligned with the same contents and labeling. That reduces the odds of opening a box during an emergency and finding empty spaces where trauma dressings or burn dressings should be. When you are ready to upgrade, you can move from scattered, mixed kits to a clear, standard system in a planned, budget friendly way.
How our products support data driven safety planning
Data driven safety planning works best when your kits and supplies match the risks you actually face. Workplace kits can be built around ANSI or ISEA Z308.1 Class A and Class B guidelines, with sizes and contents scaled to headcount, travel time to medical care, and hazard level. Construction sites, industrial plants, labs, food service kitchens, and clinics each benefit from different mixes of bleeding control items, burn products, and eye care, a variance also seen in multi-country HSE performance benchmarks that compare injury frequency rates across industry sectors.
Quality control matters because many of these items touch wounds, eyes, and airways. That is why eyewash solutions, burn gels, and many sterile components come from controlled cleanroom environments. These standards help you support your infection control goals while still meeting field realities like dust, heat, and moisture on job sites and in busy treatment areas.
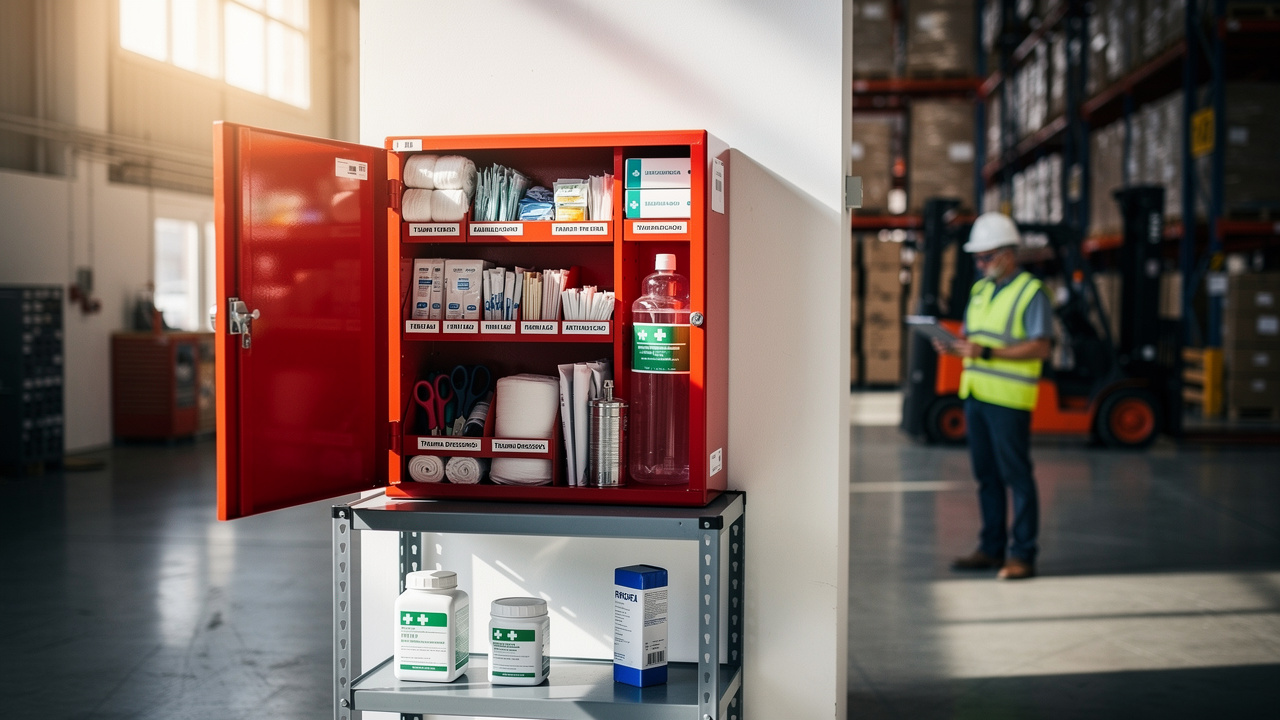
You can also standardize containers and refill flows across your system. Empty metal boxes, plastic cases, wall mounted cabinets, and labeled unitized refills make it easier to build out a custom kit program that still ties back to national standards. To see how this might look in your own operation:
Review your top injuries.
Match them to workplace kits at workplace first aid kits.
Use refill options at first aid kit refills to keep contents aligned across 2026 and 2027.
Involve local supervisors in final kit choices so supplies feel practical, not theoretical.
As you refine your 2026–2027 plan, buying from First Aid Longs gives you a direct way to turn your risk data into stocked shelves and ready responders.
In summary
Current workplace injury statistics 2026, based on 2024 and soon 2025 data, already sketch out the risk picture you will manage through 2027. Rates improve slowly, yet transportation events, falls, contact injuries, violence, and harmful exposures still cause most deaths and serious harm, especially in construction, transportation, agriculture, health care, and several service sectors.
A practical way to respond is to align your prevention, training, and first-aid programs with those patterns. Use national data and your own logs to pick a short list of top risks, then build controls, drills, and kit standards around them. Treat the BLS 2025 releases in late 2026 as checkpoints where you fine-tune, not as a reason to wait.
Now is a good time to walk your sites, check your current kit coverage, and compare it with your highest risk injuries and job classes. When you are ready to upgrade to OSHA aligned workplace first aid kits, eyewash, burn care, and refill programs that support that plan, you can partner with First Aid Longs and move from statistics on a page to real gains in worker safety.